Welcome to the Advanced OB/GYN Women's Health Center
We are a gynecology and obstetrics clinic that provides our patients with the most advanced care in prenatal tests, ultrasound, infertility and uro-gynecology.
We are proud to provide a family oriented practice with an emphasis on a happy and friendly atmosphere. Our patients, staff and Board Certified physician are always encouraged to achieve a healthy balance in their personal, professional and family lives.


Illness and minor injuries, Coviid testing, Physical, lab work, and more! Our nurse practitioner “Jenna Hanger” will be offering care to the general population of men, women, and children for routine services and health concerns.

- Package prices available upon request
- Gender determination as early as 14 weeks
- You do not have to be a patient to schedule 3D/4D, but you must be under a doctor’s care.
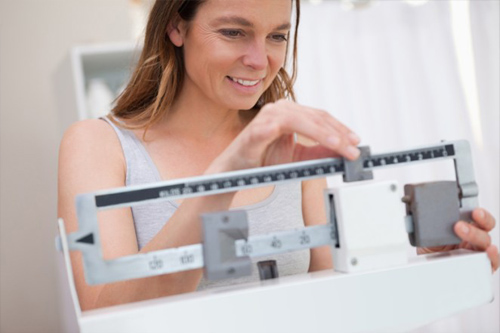
Our weight loss program includes a monthly weight-In. Blood test to monitor your body condition. Nutrition class and advice prescription of medication which fit you. Doctor consult for any questions you may have.
You can schedule online! or please call our office at 304-896-5200
Get to know us!
On our site you will find answers to basic health questions, as well as information you should know about us, not only as health care providers but as people.
Casino room login is an online casino that offers a variety of games to its players. The casino room login process is simple and quick, and it allows players to access their favorite games easily. Casino room offers a variety of bonuses and promotions to its players, which makes it an attractive option for many people.


Schedule an Appointment

Plan Table


Getting Pregnant
Even before you start trying to conceive, you should visit your doctor to ensure you’ll have the healthiest pregnancy possible.
Ready to start a family? Scheduling a visit with your ob-gyn before you start trying to conceive is a must. Considering that 50 percent of all pregnancies in the U.S. are unintended (meaning they happened without planning) and that your baby starts developing even before you know you’re pregnant, a preconception visit is one of the most significant things you can do for your future child. Your doctor will want to go over all aspects of your health history.
Even though you know the basics of the birds and the bees, you probably have a lot of questions about trying to conceive. Be sure to go to your visit with a list of questions you want to ask, no matter how intimate or silly you think they are — your doctor has probably heard them all before.

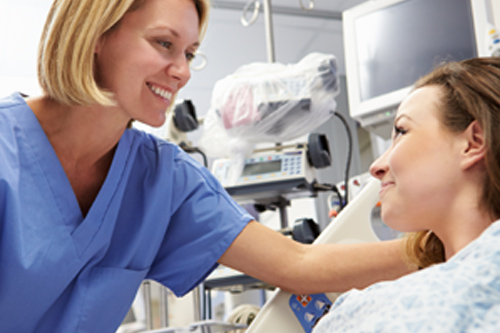
Baby Birth
Soon, you’ll experience the amazing process of childbirth! Find out how to spot the signs of labor, and get the facts on pain management, vaginal delivery, cesarean delivery, and more.
As you approach your due date, you will be looking for any little sign that labor is about to start. You might notice that your baby has “dropped” or moved lower into your pelvis. This is called “lightening.” If you have a pelvic exam during your prenatal visit, your doctor might report changes in your cervix that you cannot feel, but that suggest your body is getting ready. For some women, a flurry of energy and the impulse to cook or clean, called “nesting,” is a sign that labor is approaching.
Virtually all women worry about how they will cope with the pain of labor and delivery. Childbirth is different for everyone. So no one can predict how you will feel. The amount of pain a woman feels during labor depends partly on the size and position of her baby, the size of her pelvis, her emotions, the strength of the contractions, and her outlook.
Some women do fine with natural methods of pain relief alone. Many women blend natural methods with medications that relieve pain. Building a positive outlook on childbirth and managing fear may also help some women cope with the pain. It is important to realize that labor pain is not like pain due to illness or injury. Instead, it is caused by contractions of the uterus that are pushing your baby down and out of the birth canal. In other words, labor pain has a purpose.
Cesarean delivery, also called c-section, is surgery to deliver a baby. The baby is taken out through the mother’s abdomen. Most cesarean births result in healthy babies and mothers. But c-section is major surgery and carries risks. Healing also takes longer than with vaginal birth.
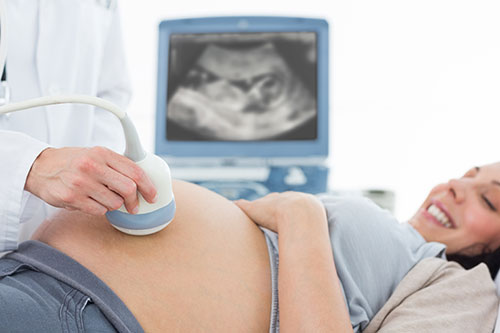
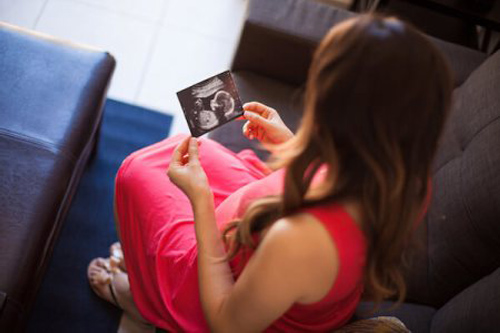
Your First Scan
If your pregnancy is going well, your first ultrasound scan will be your dating scan, between 10 weeks and 14 weeks of pregnancy.
An early scan is offered from six weeks, so before your dating scan. The doctor will only recommend an early scan if there’s a concern, for example, if you’ve had bleeding in this pregnancy. Your doctor may also refer you for a scan if you’ve had a previous miscarriage.
If this is your first baby, you might worry that you are not ready to take care of a newborn. You’re not alone. Lots of new parents feel unprepared when it’s time to bring their new babies home from the hospital. You can take steps to help yourself get ready for the transition home.
Taking a newborn care class during your pregnancy can prepare you for the real thing. But feeding and diapering a baby doll isn’t quite the same. During your hospital stay, make sure to ask the nurses for help with basic baby care. Don’t hesitate to ask the nurse to show you how to do something more than once! Remember, practice makes perfect. Before discharge, make sure you — and your partner — are comfortable with these newborn care basics:
- Handling a newborn, including supporting your baby’s neck
- Changing your baby’s diaper
- Bathing your baby
- Dressing your baby
- Swaddling your baby
- Feeding and burping your baby
- Cleaning the umbilical cord
- Caring for a healing circumcision
- Using a bulb syringe to clear your baby’s nasal passages
- Taking a newborn’s temperature
- Tips for soothing your baby
Your baby’s first doctor’s visit is another good time to ask about any infant care questions you might have.
Pregnancy
Welcome! Pregnancy is a wondrous and miraculous experience. When the pregnancy test comes back positive, you’ve begun a life-altering journey. As the baby grows and changes through each stage of pregnancy, you go through changes, too: in your body, emotions, and lifestyle. You need information to answer your questions and help you make good decisions for a healthy baby and a healthy you.

If you’re looking for a way to purchase cheap essays there are a variety of options. There are many companies online where you can find excellent value and low prices. You must however make sure that the company you pick offers high quality service. Make sure that the firm you pick is legitimate, and that it has experienced writers in your field. Based on the kind of material that you are looking for and buy essays the high quality expectations, there are four categories that can be chosen.
You may be feeling overwhelmed by your school work. Although many teachers and professors are trying to convince students to do themselves, this may not always be feasible. You may lack the time to write it on professional essay writers your own, or simply a bad writer. In this case it is best to hire an online service that will aid you in completing the essay you need to complete the assignment by the deadline.
There is a possibility of buying low-cost essay if you are facing an deadline. While it is an excellent idea, there are some things you should consider before making a decision on a service for your essay which costs lesser than $50. For starters, you need to consider the time frame. Most cheap essays you purchase need to be completed within 4 hours. However, some companies may add a fee paper helper if you want your essay completed sooner. Make sure you check the policy of the company before placing an order.